Report Series: The Economic Impacts of the Regional Greenhouse Gas Initiative on Nine Northeast and Mid-Atlantic States
BY ANALYSIS GROUP | 2015-2017, 2012-2014, 2009-2011
In a series of reports covering the lifetime of RGGI, the Analysis Group, an independent research group, uses real time historical data to assess the economic impacts of the trading system. In this process, they address these critical questions:
How has the RGGI program affected electricity markets, power producers’ costs, electricity prices, and consumers’ electricity bills?
What happened to the roughly $XX billion in proceeds collected over these three periods (2009-2011, 2012-2014, 2015-2017) from the sale of CO2 allowances?
Has the program continued to produce net economic benefits to these states, or otherwise helped them pursue their goals for reliable electric supply and CO2-emissions reductions?
What has been learned to date?
The unprecedented reports rigorously track the path of RGGI-related dollars as they leave the pockets of competitive-power generators who buy CO2 allowances to demonstrate compliance, show up in electricity prices and customer bills, make their way into state accounts, and then roll out into the economy through various pathways.
2015-2017 REPORT
The third in-depth comprehensive analysis on RGGI’s economic performance, this report finds – once again – a consistent trend of positive net economic value. The Analysis Group tracks the most recent three-year compliance period (2015-2017), and examines the empirical economic data.
KEY FINDINGS
RGGI states reaped $1.4 billion in net economic value from the Program’s implementation in 2015 through 2017.
Over the same time period, RGGI is credited with creating over 14,500 new job-years (the equivalent of one full-time job for the duration of one year).
All of the participating RGGI states experienced benefits, including employment growth and net economic benefits for electricity consumers, with those dollars flowing back into the local economy.
2012-2014 REPORT
The second in a series of economic analyses by the Analysis Group, this report examines the impacts of RGGI for the period 2012-2014, the second compliance period, and finds that the multi-state, market-based approach to cutting carbon emissions provides economic benefits and valuable lessons to other states as they evaluate their options for cutting carbon.
KEY FINDINGS
Added $1.3 billion in economic value to the nine-state RGGI region.
Will lead to more than 14,000 new jobs.
Reduced electricity and heating bills, saving consumers $460 million.
Provided each individual state economic benefits as the region cuts annual carbon emissions by more than a third from 2008 (133 million tons) to 2014 (86 million tons).
Reduced dollars flowing out of state to pay for fossil fuels imported from outside the region by more than $1.27 billion.
2009-2011 REPORT
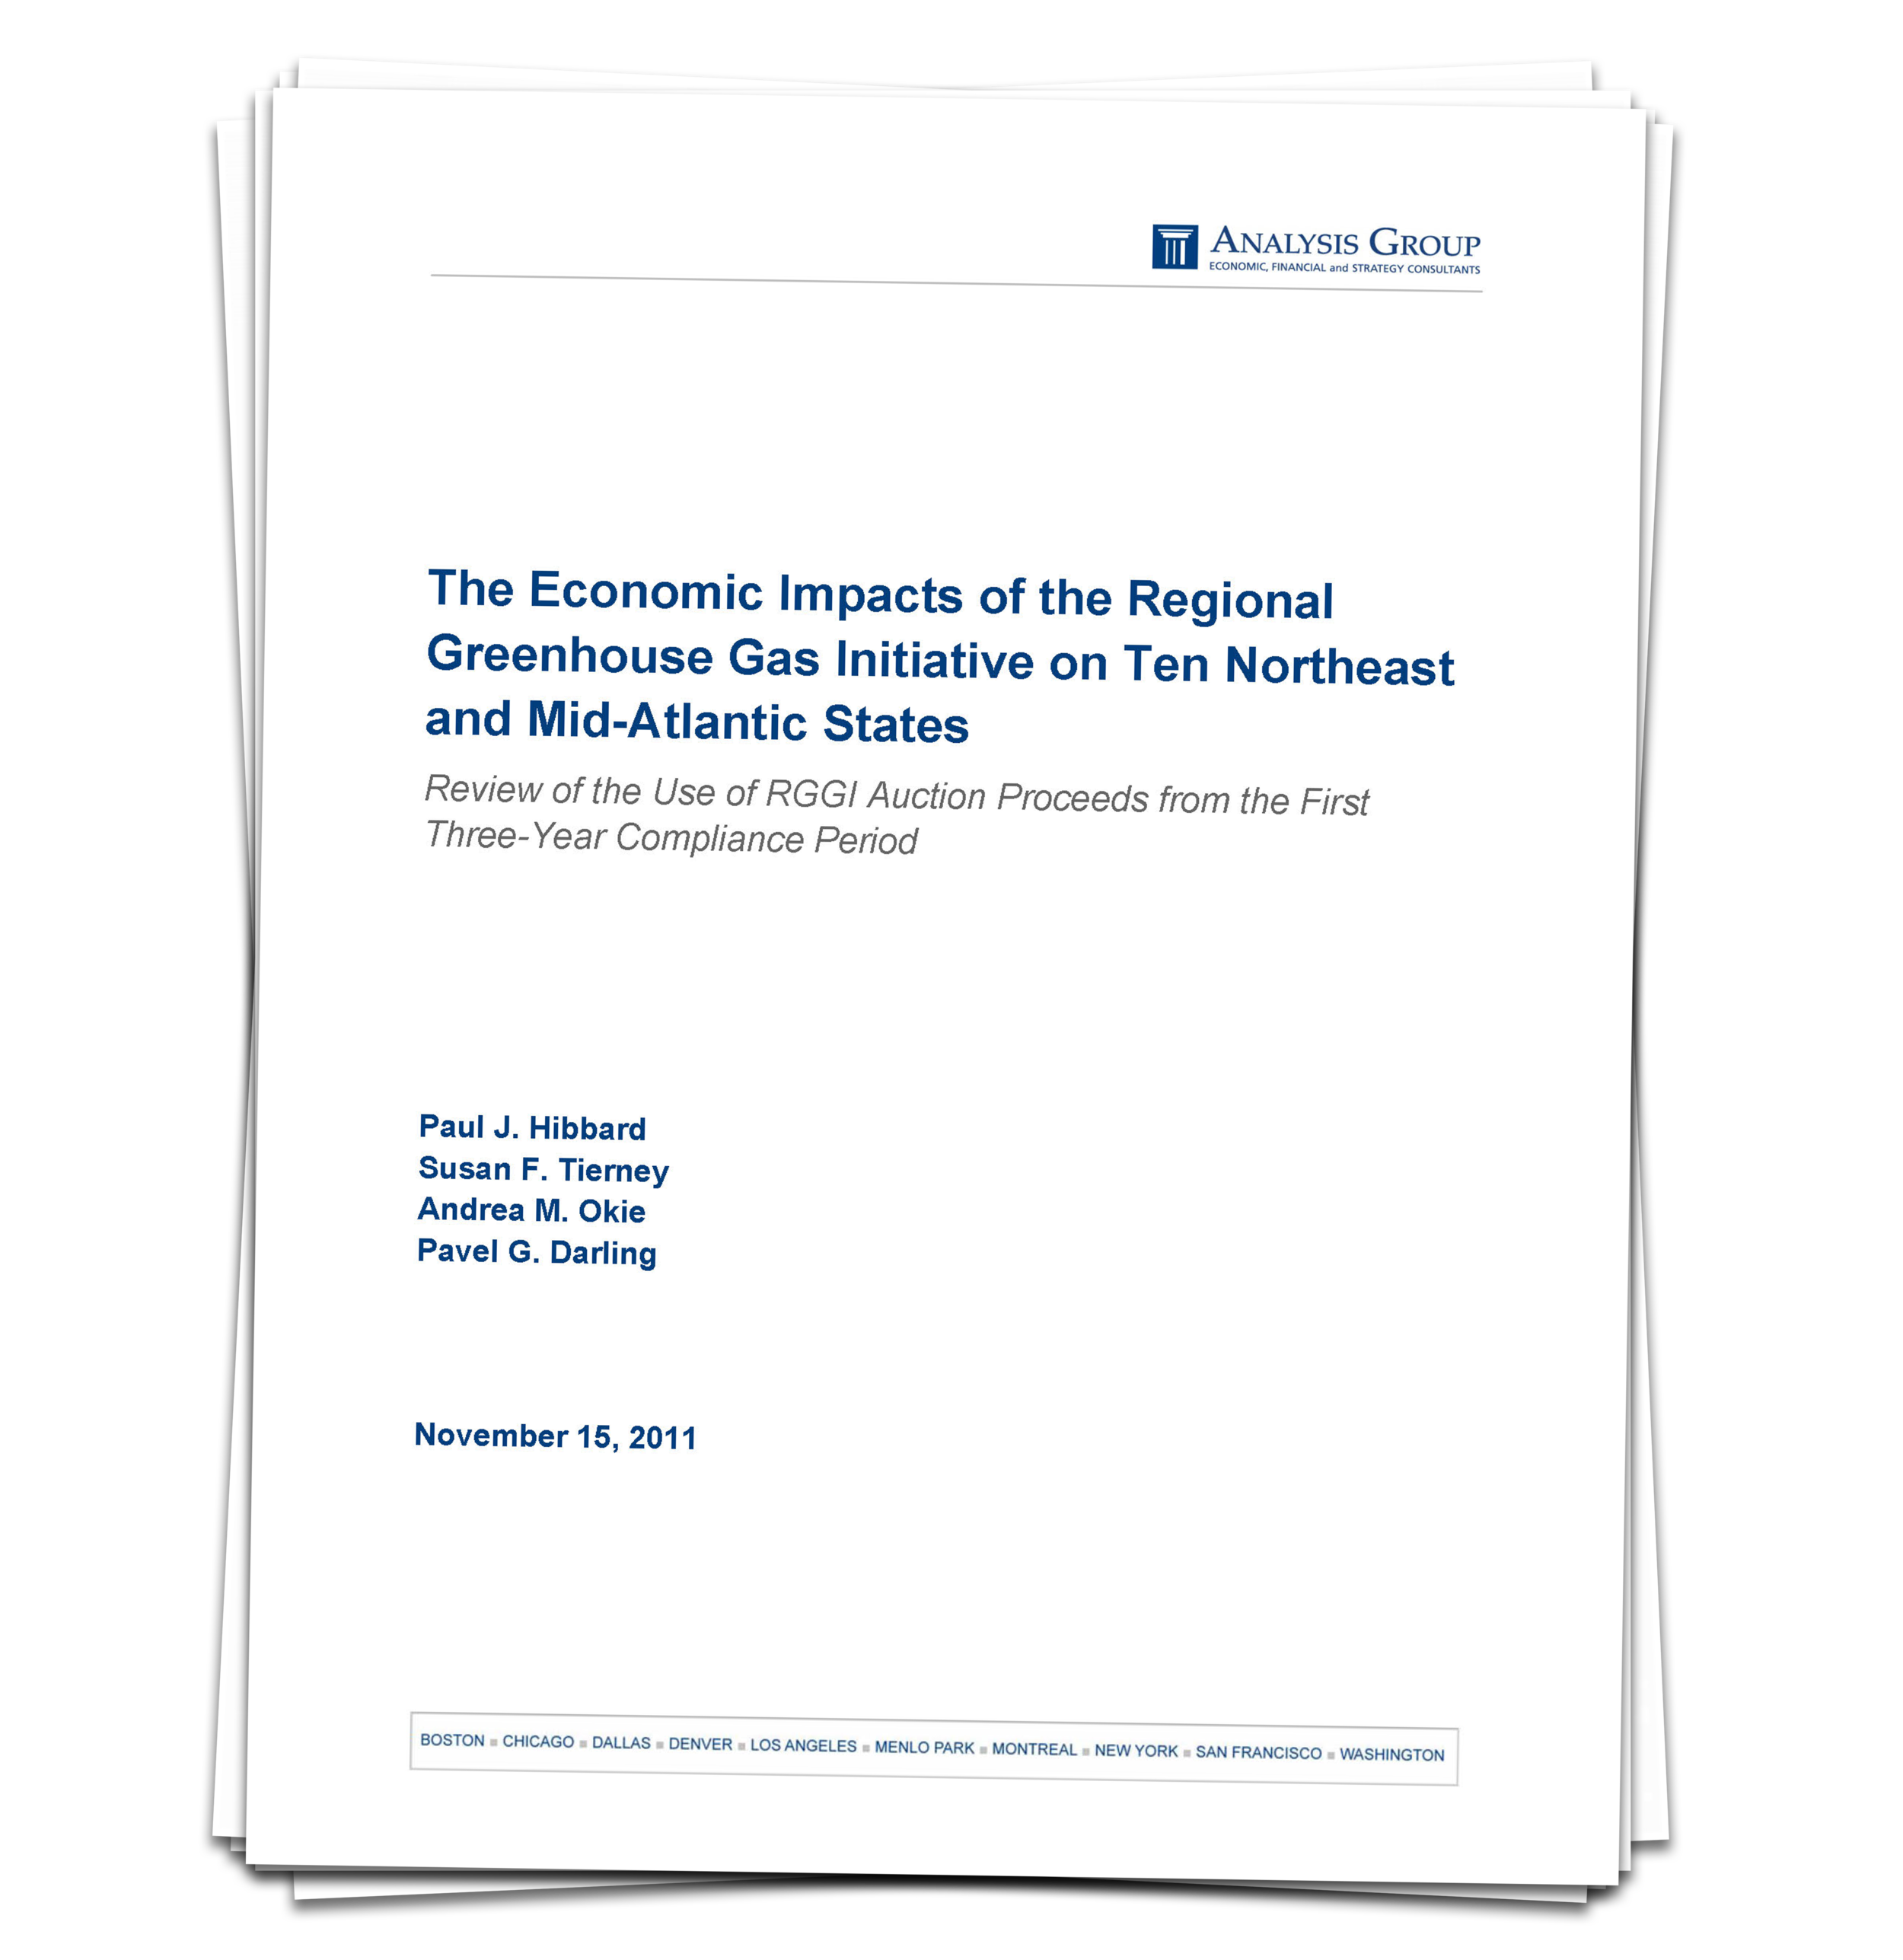
While prior analyses were based on projections of RGGI performance, this report provides the first comprehensive analysis of actual RGGI performance based on real data. It found that RGGI generates greater economic growth in every one of the 10 RGGI states than would occur without a carbon price. Given that the purpose of RGGI is to reduce carbon, not generate economic growth, this analysis received widespread media coverage and had a dramatic impact on public understanding of the trading system, not just among RGGI stakeholders and policymakers, but also in states weighing the risks and benefits of a price on carbon.
KEY FINDINGS
$1.6 billion in growth
$912 million in allowance proceeds
$1.3 billion in energy savings to consumers
Power plant owners lose $1.6 billion in revenue
$765 million kept in local economy
16,000 net jobs created


